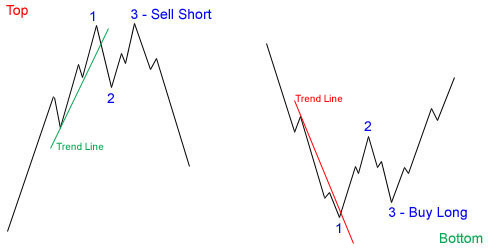
 I little while ago I finished the CD-ROM course by Kevin Haggerty called “How to successfully trade the 123 strategy.” It took me about a month, using whatever spare time I had, however those with plenty of spare time can finish the Kevin Haggerty course in a week or less.
The course is basically an in-depth look at double bottoms and double tops. It should be called “How to trade double bottoms and double tops,” but that I guess would not sell any courses, so they use a fancier title.
The Kevin Haggerty 123 method course starts off by telling you, that this method can only be employed at extremes. By extremes the 123 trading strategy means that when a stock, index or any financial instrument has move big on the upside or downside and the top or bottom would be marked by three confirmed price action pivot points (the 123 strategy).
“How to successfully trade the 123 strategy course,” then introduces you to the 3 different types of tops and bottoms.
For tops or short signals they are:
A. 123 Lower Top
- when the price makes a high, retraces, then goes back up but cannot break the previous high.
B. 123 Double Top
- when the price makes a high, retraces, then goes back up to the high set by previous upward movement, but cannot break it and comes back down.
C. 123 Highter Top
- when the price makes a high, retraces, then goes back up and breaks higher pass the high set by previous upward movement, but cannot maintain the upward momentum and the price comes back down (reverses).

For bottoms or long signals they are:
A. 123 Higher Bottom
- when the price makes a low, bounces up, then goes back down but does not break the previous low (support).
B. 123 Double Bottom
- when the price makes a low, bounces up, then goes back down to the low set by previous downward movement, but cannot break the previous low and bounces back up.
C. 123 Lower Bottom (Shake & Bake )
- when the price makes a low, bounces up, then goes back down and breaks lower through the low (support) set by previous downward movement, but cannot maintain the downward momentum for long and the price bounces back up (reverses).
Each pivot point in the 123 trading strategy is confirmed by a break in the trend line, and there needs to be 3 confirmed pivots or reversals before buying into the stock, option or whatever financial instrument you are targeting.
In this course, Kevin Haggerty recommends to place your stop loss order just below pivot point 3 if you are long. If you are selling short then you place the stop above pivot point 3.
In addition to some money management tips, the 123 strategy trading course also walks you through many successful trades and some fake out trades using a flash web media simulator. I think this feature is really cool and definitely aids in training you to become a better trader technically. The simulator, will help you determine when to get into a trade and when to get out and just as importantly when to just wait.
This is a good course, and I recommend it if you are a fairly new trader less than 1 year experience, though even experience traders can re-enforce their skills with this course.
Applying this 123 trading strategy to the current market condition, it does not seem that any of the indexes has even completed the bottoming 123 pattern yet. It’s going to be weeks or maybe a few months before the bottom of the stock markets works itself out.
Bookmark at:
StumbleUpon | Digg | Del.icio.us | Dzone | Newsvine | Spurl | Simpy | Furl | Reddit | Yahoo! MyWeb


[...] In the next few weeks to month, I will be looking to buy into long-term option contracts of selective stocks that look like they’ve reached a bottom. In the last 6 months buying shorter-term CALL option contracts has lead to some losses in my portfolio to be honest. Look at the chart below of the $DJX, the decline started from mid October 2007 to just January 22, 2008 then a bounce and now we are heading back down. To be on the safe side, I will now only look at LEAPS which are long-term option contracts with at least 1 year before expiration. Looking at the $DJX Dow Jones 100 chart we can see to the far right of the chart, recently the Dow Jones market has try to form “W” shape but failed, and it looks like it is dipping back down. Read the “Trading the 123 Strategy” for double bottom info. My guess here is the $DJX may go back down to the 122 (DJIA would be 12200) before turning up or go sideways more with a series of small bounces. [...]