by Das Brain
Yesterday, I sold off my 100 shares in Tiffany & Co. you know the upscale department store that sells all that fancy jewelry and gifts. Ya them, Tiffany & Co’s stock symbol TIF is traded on the New York Stock Exchange (NYSE) and I researched the company’s fundamentals and analyzed the trends, charts back in June 2006.
I bought the 100 shares of Tiffany’s stock at $30.94 USD inside my Registered Retirement Fund on in August and sold 100 shares yesterday at $41.37 USD. Okay let’s do the math.
Bought 100 X $30.94 = $3094
Sold 100 X $41.37 = $4137
So to calculate the profit it goes something like this $4137 – $3094 = $1043 minus commissions, which is $29 X 2 (buy/sell) = $58. After trade commissions it’s $1043 – $58 = $985. Not bad, and this is all inside my retirement fund, so it’s tax free. What I am going to do here is just let this cash collect interest until July, Aug 2007 at which time I will get back into TIF:NYSE.
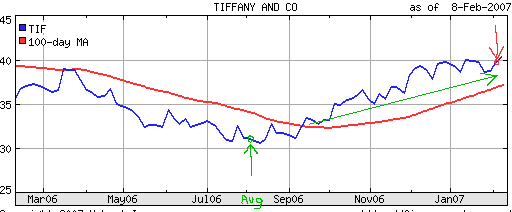
Okay, to fully examine this trade we need the chart. Visually a chart will tell you when to get in and out of a trade.

 Â
Â
As you can see, I purchased the stock before the red line which is the 100 day moving average touched the blue line. Usually when the red line touches the blue line which is the stock price and goes under the blue line, it is a sign to get in and buy the stock. By fluke I got in and bought TIF stock just before, following my rule of thumb of “sow in August and harvest in Jan-Feb.”
Notice how the red line (100 day moving average) stays under the blue line (stock price) and kind of moving up with the stock price. Now when the red line again moves upward and crosses the blue line and goes above the blue line, this means get out and sell your position. You will notice that I sold my TIF stocks yesterday, but the red line is still under the blue line or stock price.
You are probably wonderin’ WTF am I doing. Well, again my rule is don’t be greedy and sell in Jan or Feb. Remember, I am not a day trader and I don’t check my portfolio constantly. That red line (100 day moving average) is moving up there and getting closer to that blue line. I estimate another week to a month before the two converge and I don’t want to forget to sell it.
One thing to note is take your profits when you have an opportunity. Trust me, you can always make more by waiting a little longer, but at the same time you can make less or worse yet lose some money if you are not paying attention. Trust me I’ve seen what happens, when people think…oh let’s just wait a bit longer I can make more, but that is another story. Be happy with what you’ve made, there is a ton more opportunities. Greed in the market place will always bite you in the arse.
Bookmark at:
StumbleUpon | Digg | Del.icio.us | Dzone | Newsvine | Spurl | Simpy | Furl | Reddit | Yahoo! MyWeb

