Looking at the charts of most U.S indexes over the last 2 weeks or so, it is clear that things are definitely volatile. The stock market have been bouncing up and down and having trouble breaking past previous ceiling. The markets are trading in a range right now.
Archive for the ‘Option Trading’ Category
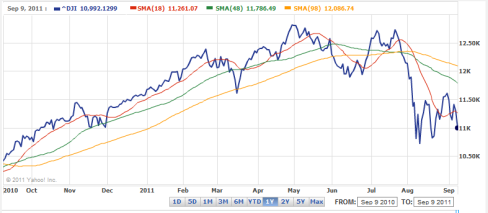
Dow Jones Industrial Average Crashes 303 Points Today – More Downside To Come, Recession Ahead?
Friday, September 9th, 2011Nasdaq Trading In A Range 2350 – 2470 Roughly – Increased Position In HQD.TO
Thursday, August 25th, 2011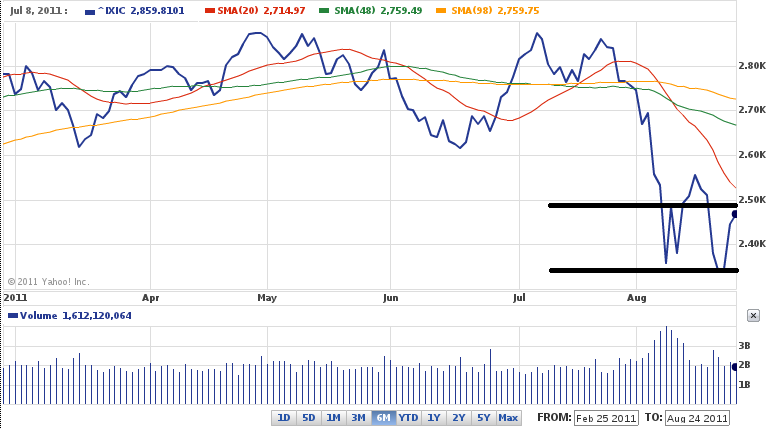
I’ve been keeping a close eye on the Nasdaq and it has been trading in range right now between 2350 to 2470. There seems to be downward pressure because every time it rallies up, it cannot seem to get past 2470 to shoot through previous high of around 2560.
All over the financial news, they say that traders are all waiting for an announcement from Ben Bernake at the Jackson Hole, economic conference. So, that is why there is a range being formed until the Friday announcement.
Next Stop, Dow 8,200: Nasdaq 1750 – Futures Trader
Monday, August 15th, 2011If this future trader is betting that the Dow Jones Industrial Average is going towards near 2009 lows of 8200, then it should take the Nasdaq also down to near 2009 lows, which is around 1750 points. I would have to agree with this view and it might take several months to get to that level, however you never know sometimes with the market, so we will just have to wait and see.
Waiting For Nasdaq To Crash Lower – Next Few Month(s) with HQD.TO Bear/Short ETF
Friday, August 12th, 2011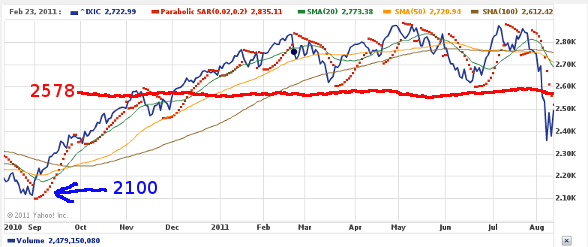
I started purchasing HQD.TO (Horizon Bear Nasdaq ETF) again. Some at 2450, and then some at 2500 points on the Nasdaq. I will look at loading up some more when the Nasdaq hits 2578 or higher, if it ever gets there.
If you think about the highs for the Nasdaq this year which was slightly above 2800, it is unlikely in this current economic environment that it will hit that high again.
Signs That The U.S Economy Is Slowing Down / Losing Steam
Sunday, April 17th, 2011
Below are the signs that the United States Economy is meeting some headwinds.
RIM BlackBerry Smartphones and Tablet Is Behind The “Curve” – No Pun Intended
Saturday, March 12th, 2011
RIM has fallen behind big time and they got to innovate fast as they have been leap frogged by Apple and Google. I’m Canadian and sure I want a Canadian technology company to succeed, but that doesn’t mean RIM will because I think they got too comfortable…RIM reminds me of Nortel and it might end up like Nortel if RIM doesn’t swallow its pride. Nortel got so big and popular and they rested on their laurels instead of looking to the future and innovating.
Entered Trade with QQQQ Put Options – Mar 2011 @ $44 Strike Price
Friday, October 1st, 2010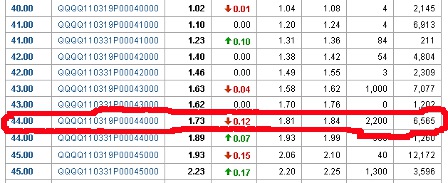
Well, the month of September had a nice run…the DOW, SP&500 and Nasdaq bounced back up. However, whenever there is a significant run up there has to be a pull back.
As far as the economy is concerned there is nothing in my view supporting the recent run up in the markets. From the macro view the U.S is still in huge deficit, government spending continues and jobs are still being lost despite corporations making record profit. Now add to that the recent report that over 40 million Americans are now considered poor, while the middle-class is being wiped out.
Closed Position on SLV (Silver ETF) Options – Made Small Profit
Sunday, September 26th, 2010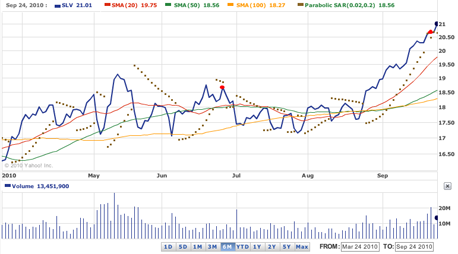
In previous post on MoneyAccumulator.com I wrote about the CALL options I bought on SLV (Silver ETF) for expiry of January 2010 with a strike price of $19. Well, I recently sold the options contract when the SLV ETF reached the price of $20.60.
Silver On The Move Above $20 – iShares Silver Trust (SLV) ETF
Thursday, September 16th, 2010
About 3 months ago, I bought contracts in iShares Silver Trust (SLV) ETF kind of as an experiment or litmus test to see my hunches are correct.
If the stock market and economy falters in the next 3 months by January 2010 SLV contracts with a strike price of $19 will make some money as long as the contract price exceeds my break even of $2.10. Currently the contract price is at $2.23 (Sept.16, 2010).
Dow Jones Finished Slightly Above 10,000
Sunday, August 29th, 2010
I posted on Tuesday, August 17th that the Dow Jones will drop to 10,000 points from 10,450 points then bounce a bit, and again head lower to the next support level 9,600. As you can see from trading the actions of August 26 and 27 that it is exactly how it is playing out.
Staying Out of Stocks Until Down Leg is Done – DJIA Shows Downtrend
Tuesday, August 17th, 2010
Looking at the 6 month chart for the DJIA, it looks like the market is at the beginning of a downtrend, the 10 and 200 day moving average is well over the price adding to downward pressure, however it looks like their might be a small pop upwards as the price hits the 50-day moving average, but after that my guess is that the downward trend will continue bringing the Dow Jones down to 10,000 and if it breaks past that down to 9,600 again. Also looking at the MACD it looks like a downward indicator as well ( please read my disclaimer). I have been wrong before so do your own due deligence, this is just my read on the market.