Archive for the ‘Technical Analysis’ Category
Friday, December 23rd, 2011
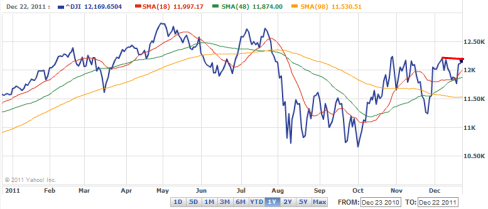
The fact that today is 2 days to Christmas and there have been a very dismal market move upwards, I think this sets up a bad tone for the markets going into the first quarter of next year.
The market strength is just not there and using technical analysis looking both the DOW and Nasdaq charts it seems the the DJIA is going sideways and the Nasdaq is starting to trend down. Both the DOW and Nasdaq shows declining volumes as well.
This is a preview of
No or Dismal Santa Claus Rally 2011 Means Probably Down Q1 2012
.
Read the full post (191 words, 2 images, estimated 46 secs reading time)
Posted in Economy, Option Trading, Stock Trading, Technical Analysis | Comments Off
Monday, December 5th, 2011
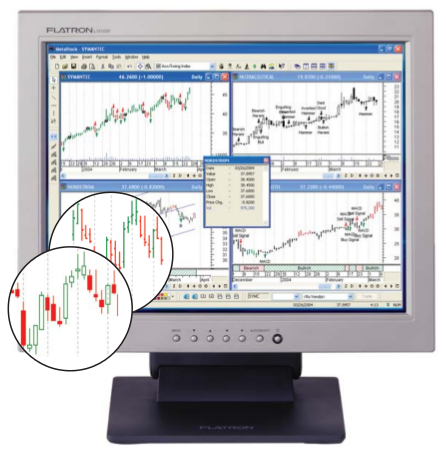
MetaStock End-of-Day is made for the swing, mid-term or long term trader who doesn’t need up to the second or minute stock, currency, index or commodity quotes. Rather MetaStock End of Day is for doing analysis on price action after the market has closed. For real-time traders they need to look over MetaStock Pro and MetaStock Pro FX.
This is a preview of
MetaStock 11 for End-of-Day Traders – Professional Financial Charting Software – Review
.
Read the full post (1566 words, 1 image, estimated 6:16 mins reading time)
Posted in ETF, Option Trading, Stock Trading, Technical Analysis, Technology, Trading Psychology | Comments Off
Saturday, November 26th, 2011

Looking at current economic events, it doesn’t seem like there will be any trigger for a “Santa Claus” rally in the markets this year. Not, just the macro picture is saying this, the technical analysis of the charts say the same thing, there has been a breakdown in the price actions across all markets around the world.
I personally have a bad feeling about December 2011 and January 2012 for the markets. Read the article below by ZeroHedge for more details.
This is a preview of
No Santa Claus Rally This Year 2011 In The Stock Markets – All Technicals Point To “Nay”
.
Read the full post (96 words, 1 image, estimated 23 secs reading time)
Posted in Economy, Politics, Technical Analysis, Trading Psychology | Comments Off
Wednesday, November 9th, 2011
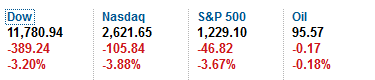
All U.S stock market indexes took roughly a 3.5% haircut today. Question is this, “Is it down from here?” and “Is there going to be a santa claus rally this year?”
The answer to both of these question is who knows, anybody’s guess. The stock market now a days have pretty much been manipulated by the U.S Government and Federal Exchange who pump borrowed /printed money into the markets to inflate them.
This is a preview of
Dow Jones Industrial Average Down 389 Points Today, Is It Downhill From Here?
.
Read the full post (262 words, 1 image, estimated 1:03 mins reading time)
Posted in ETF, Economy, Money, Option Trading, Politics, Stock Trading, Technical Analysis, Trading Psychology | Comments Off
Sunday, October 16th, 2011
Gary Schilling the author of “The Age of De-Leveraging” thinks there will be more pain ahead. As the economy stalls, demand for goods and commodities will fall causing deflation and subsequently stock markets will fall.
Permanent link to this post (36 words, estimated 9 secs reading time)
Posted in Economy, Politics, Stock Trading, Technical Analysis, Trading Psychology, Videos | Comments Off
Monday, October 10th, 2011
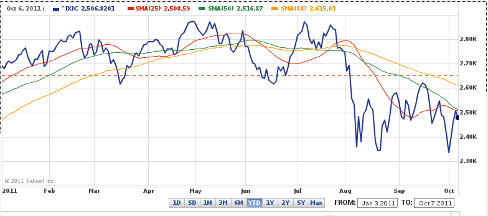
I recently added more HQD.TO (Horizon Nasdaq Bear ETF on TSX) position, the reason is because I foresee limited upside and more downside risk within the next 1.5 years. The Nasdaq from here might pop a little higher towards 2700 but I do not think that would happen this year.
Posted in ETF, Economy, Stock Trading, Technical Analysis | Comments Off
Tuesday, September 27th, 2011
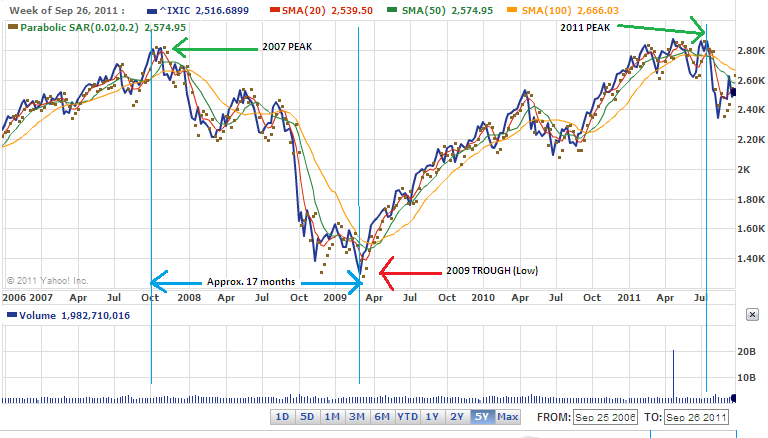
The 2007 violent sharp downward move happend on Oct.29th which signal the bear market that eventually ended and bottomed on March, 2009. From the beginning of the bear market crash to the bottom the timeframe was 17 months roughly. The pattern is pretty much the same for all markets Dow Jones, Nasdaq and S&P 500.
This is a preview of
One Year and a Half To Next Stock Market Bottom – Dec, 2012 or Jan 2013
.
Read the full post (320 words, 1 image, estimated 1:17 mins reading time)
Posted in Economy, Politics, Stock Trading, Technical Analysis, Trading Psychology | Comments Off
Friday, September 23rd, 2011
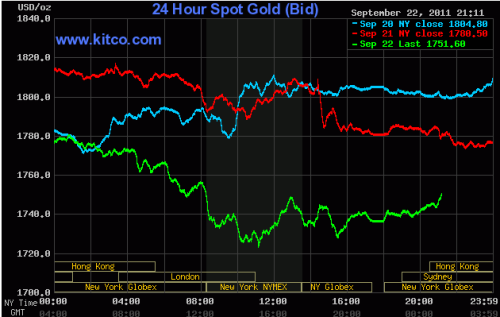
Lucky I just switched my TD Precious Metal Fund over to TD Canadian Bond fund. I moved my TD Precious Metal Fund over when it closed at the NAV of $79.48 about a week or so ago and on the day gold drop $64.90 (Sept 22, 2011), the closing NAV on Sept 22nd of the TD Precious Metal Fund is $70.64. Wow, that is a drop of almost $9. One thing about precious metal mutual funds is that it moves in tandem with mainly the stock prices of gold mining companies, and it would seem that the gold mining companies also took a hit.
This is a preview of
Gold Drops, Takes A $64.90 Hit – Correcting A Bit?
.
Read the full post (187 words, 1 image, estimated 45 secs reading time)
Posted in Economy, Money, Personal Finance, Stock Trading, Technical Analysis | Comments Off
Friday, September 9th, 2011
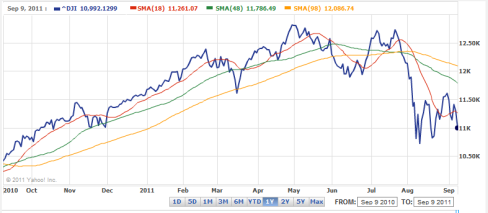
Looking at the charts of most U.S indexes over the last 2 weeks or so, it is clear that things are definitely volatile. The stock market have been bouncing up and down and having trouble breaking past previous ceiling. The markets are trading in a range right now.
This is a preview of
Dow Jones Industrial Average Crashes 303 Points Today – More Downside To Come, Recession Ahead?
.
Read the full post (238 words, 1 image, estimated 57 secs reading time)
Posted in Economy, Option Trading, Stock Trading, Technical Analysis, Trading Psychology | No Comments »
Thursday, August 25th, 2011
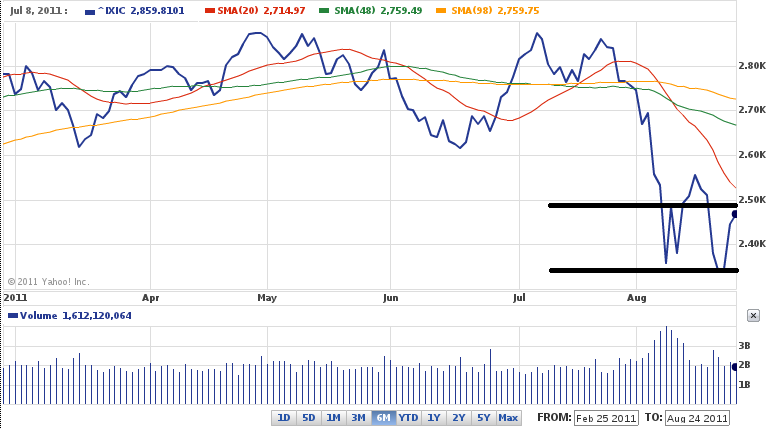
I’ve been keeping a close eye on the Nasdaq and it has been trading in range right now between 2350 to 2470. There seems to be downward pressure because every time it rallies up, it cannot seem to get past 2470 to shoot through previous high of around 2560.
All over the financial news, they say that traders are all waiting for an announcement from Ben Bernake at the Jackson Hole, economic conference. So, that is why there is a range being formed until the Friday announcement.
This is a preview of
Nasdaq Trading In A Range 2350 – 2470 Roughly – Increased Position In HQD.TO
.
Read the full post (142 words, 1 image, estimated 34 secs reading time)
Posted in ETF, Option Trading, Stock Trading, Technical Analysis | No Comments »
Monday, August 15th, 2011
If this future trader is betting that the Dow Jones Industrial Average is going towards near 2009 lows of 8200, then it should take the Nasdaq also down to near 2009 lows, which is around 1750 points. I would have to agree with this view and it might take several months to get to that level, however you never know sometimes with the market, so we will just have to wait and see.
This is a preview of
Next Stop, Dow 8,200: Nasdaq 1750 – Futures Trader
.
Read the full post (78 words, estimated 19 secs reading time)
Posted in ETF, Economy, Option Trading, Stock Trading, Technical Analysis, Trading Psychology, Videos | No Comments »