Archive for the ‘Technical Analysis’ Category
Friday, August 12th, 2011
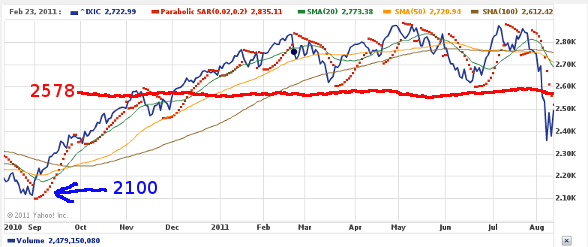
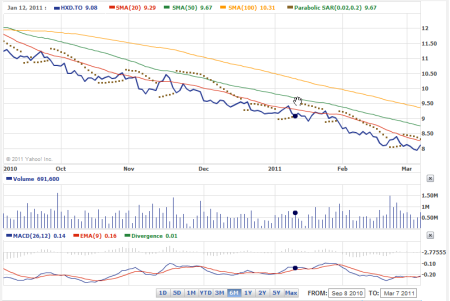
I started purchasing HQD.TO (Horizon Bear Nasdaq ETF) again. Some at 2450, and then some at 2500 points on the Nasdaq. I will look at loading up some more when the Nasdaq hits 2578 or higher, if it ever gets there.
If you think about the highs for the Nasdaq this year which was slightly above 2800, it is unlikely in this current economic environment that it will hit that high again.
This is a preview of
Waiting For Nasdaq To Crash Lower – Next Few Month(s) with HQD.TO Bear/Short ETF
.
Read the full post (211 words, 1 image, estimated 51 secs reading time)
Posted in ETF, Economy, Option Trading, Stock Trading, Technical Analysis, Trading Psychology | No Comments »
Monday, August 8th, 2011
About 6 months ago I warned a family member to move all his investment to cash or Canadian bond position, however the response I got back, was “Why should I do that, the financial stocks are doing very well now.”
I however, did not press the issue with this family member because I didn’t want to seem like a know it all, but I knew that the rise in the stock market will be followed by a sharp and violent downturn and it finally arrived.
This is a preview of
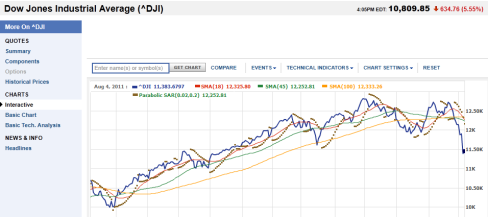
Dow Jones Industrial Average Crashes 634 Points Today – Signalling New Recession Ahead
.
Read the full post (319 words, 1 image, estimated 1:17 mins reading time)
Posted in ETF, Economy, Retirement Planning, Stock Trading, Technical Analysis, Trading Psychology | Comments Off
Friday, June 10th, 2011
I’ve been anticipating the U.S stock market decline for a while now and this week the Dow Jones industrial average declined below 12,000.
I believe there is more downside coming in the near future. My initial assumption was that this decline will start near the end of June, however with markets it is always difficult to know when it will actually happen.
This is a preview of
Economy and Stock Market Turning Down – QE3 is Inevitable
.
Read the full post (231 words, estimated 55 secs reading time)
Posted in Debt Management, ETF, Economy, Technical Analysis, Trading Psychology, Videos | Comments Off
Wednesday, May 25th, 2011
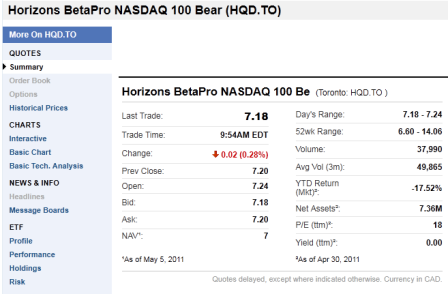
As the stock market loses strength here and has problems moving higher I have increased my positions in both the Horizon Nasdaq bear ETF (HQD.TO) and the Horizon S&P bear ETF (HSD.TO). The Nasdaq index has had problems breaking above 2800 and the S&P has no ooomph to get past 1340 and it is stays like this for another month then I think we are going down.
This is a preview of
Increased Positions In Bearish Funds – Horizon Nasdaq and S&P Bear ETF
.
Read the full post (263 words, 2 images, estimated 1:03 mins reading time)
Posted in ETF, Economy, Technical Analysis | Comments Off
Monday, May 16th, 2011
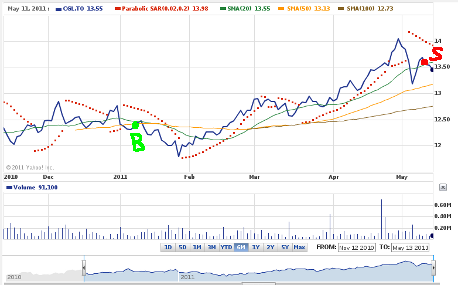
I recently sold off my position in Claymore’s Gold ETF that is traded on the Toronto Stock Exchange (CGL.TO). I bought at $12.45 in early January and just sold at $13.58 which is roughly a return of 9% minus commissions. That is just under 9% return for 5 months, that is not bad considering money market and guaranteed investment certificates (GIC’s) are interest are very low.
This is a preview of
Closed Position On Claymore Gold ETF (CGL.TO) – Take Some Profit
.
Read the full post (133 words, 1 image, estimated 32 secs reading time)
Posted in ETF, Technical Analysis | Comments Off
Saturday, April 30th, 2011
In the short-term this might be true for the stock market, both S&P and Nasdaq broke out. I think it is possible to see S&P up to 1500 and Nasdaq up to 3000 however only in the short term (3 months) though. After that I don’t see much evidence of economic growth to push the stock market higher…unless U.S Fed , Bernanke prints more digital money out of thin air.
This is a preview of
Stocks Are Going Higher and Oil is Going Lower?
.
Read the full post (115 words, estimated 28 secs reading time)
Posted in Economy, Technical Analysis, Videos | Comments Off
Sunday, April 17th, 2011
Below are the signs that the United States Economy is meeting some headwinds.
This is a preview of
Signs That The U.S Economy Is Slowing Down / Losing Steam
.
Read the full post (243 words, 1 image, estimated 58 secs reading time)
Posted in Economy, Option Trading, Stock Trading, Technical Analysis | 1 Comment »
Friday, March 25th, 2011
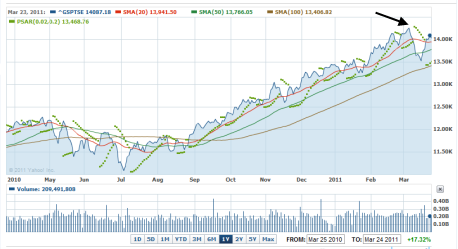
About 2 weeks ago I posted about entering a possible in HXD-TO the Horizons BetaPro S&P/TSX 60 Bear Plus ETF. Well, about a week ago I opened a position in HXD-TO. The Toronto Stock Exchange peaked at around 14,500 where the arrow is on the chart above, however this then it has had trouble reaching that level.
This is a preview of
Opened Position on HXD – Horizons BetaPro S&P/TSX 60 Bear Plus ETF
.
Read the full post (223 words, 1 image, estimated 54 secs reading time)
Posted in ETF, Stock Trading, Technical Analysis | Comments Off
Tuesday, March 15th, 2011
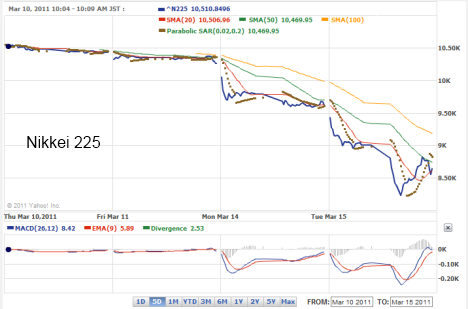
Well before the Japan earthquake and tsunami the stock markets were already looking a little weak as if they have almost reached their top. However, like the event on September 11th back in year 2001 which saw the U.S markets taking a dive on the destruction of 2 buildings and over 5000 people killed, the Japan earthquake and tsunami will be the catalyst of the next leg down of the stock market as the damage is far greater and the economic impact is larger.
This is a preview of
Markets Are About To Take A Beating – Japan Earthquake / Stock Market Decline A Catalyst
.
Read the full post (231 words, 1 image, estimated 55 secs reading time)
Posted in ETF, Economy, Technical Analysis, Trading Psychology | Comments Off
Tuesday, March 8th, 2011
The Toronto Stock Exchange look like it is set to hit the previous high of around 15,000 points at which time my prediction is that it will take a turn downward. This could be a correction of sorts that I could profit from. The 15,000 level also looks to be a top of a cycle and from there it could very well be down hill for a while.
This is a preview of
Looking At Opening Position on HXD-TO – Horizons BetaPro S&P/TSX 60 Bear Plus ETF
.
Read the full post (202 words, 1 image, estimated 48 secs reading time)
Posted in ETF, Stock Trading, Technical Analysis, Trading Psychology | Comments Off
Monday, February 21st, 2011
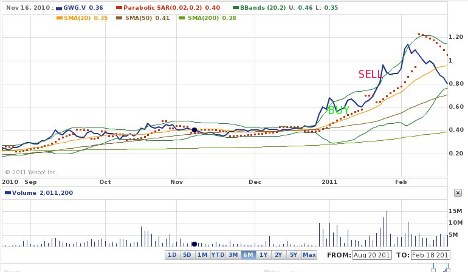
Earlier in January, I spotted a Canadian rare earth mining company called Great Western Minerals group that trades on the Toronto Venture Exchange, stock symbol GWG.V that broke out from a sideways price consolidation. As you can see from the chart it was hovering at around $0.40 for quite a long time (3-4 months) and then it broke to the upside.
This is a preview of
Quick Trade and Profit On Canadian Rare Earth Stock – GWG.V – Great Western Minerals Group
.
Read the full post (211 words, 1 image, estimated 51 secs reading time)
Posted in Technical Analysis, Technology | Comments Off