Yesterday gold took a hit from roughly $1412 down to $1380 range…that was a drop of roughly $30 some odd dollars. I’ve been watching gold for a while, though I should have gotten long ago…I think there is still more upside for gold.
Archive for the ‘Technical Analysis’ Category
Opened Position On Claymore Gold Bullion ETF (CGL.TO) @ $12.45
Wednesday, January 5th, 2011Bought Some Horizons BetaPro NYMEX Crude Oil Bull (HOU.TO) ETF Shares – Potential Rise In OIL
Wednesday, December 8th, 2010
Crude oil recently hit $90 a barrel and then retreated, however all the talk in the market is that cost per barrel of crude oil will hit about $100. In light of this I purchased a few weeks ago ETF shares in Horizons BetaPro NYMEX Crude Oil Bull (HOU.TO) when oil was at a price of $84…right now it is trading at $88-89. Few factors at play, we are going into the winter months and there will be a rise in demand next year according to most financial websites.
Entered Bearish Position with Canadian ETFs for S&P500 and Nasdaq 100
Thursday, October 21st, 2010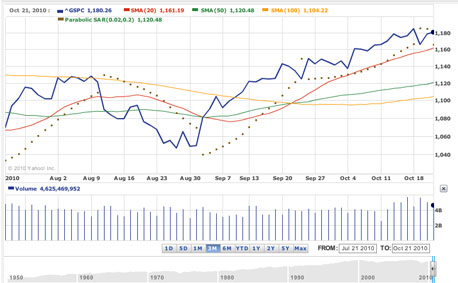
Well, looking at the charts today, it would seem that the S&P500 is showing some signs of a little weakness. After a huge run up for the DJIA, Nasdaq and S&P500, I believe things are going to stop going up and a reversal is in order. Don’t know exactly when it will hit maybe a week or two or maybe even a month, but I think we are getting a little long in tooth here.
The U.S Stock Market Has Rallied Big Time Amid Worsening Job Situation and Local Government Out of Money
Thursday, October 14th, 2010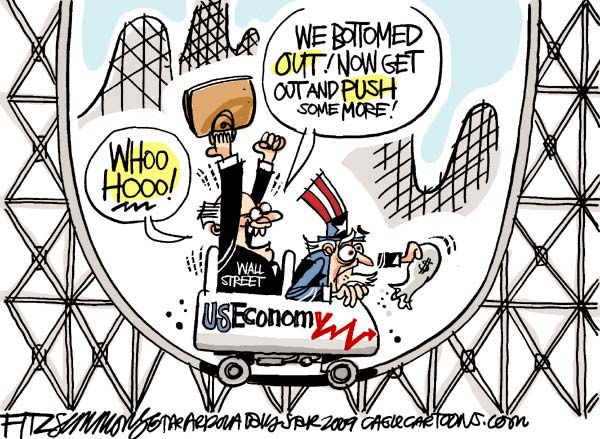
The U.S puts out reports that the recession ended last year sometime, and the Federal Reserve say that they are going to do more “Quantitative Easing” to further stimulate the economy. The stock market responds by sending the Dow Jones Industrial Average well over 11,000. All this in my personal opinion is hog wash, it is just more U.S Government propaganda to make things seem a lot better than they are.
Entered Trade with QQQQ Put Options – Mar 2011 @ $44 Strike Price
Friday, October 1st, 2010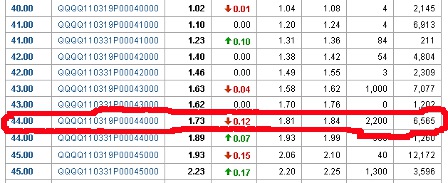
Well, the month of September had a nice run…the DOW, SP&500 and Nasdaq bounced back up. However, whenever there is a significant run up there has to be a pull back.
As far as the economy is concerned there is nothing in my view supporting the recent run up in the markets. From the macro view the U.S is still in huge deficit, government spending continues and jobs are still being lost despite corporations making record profit. Now add to that the recent report that over 40 million Americans are now considered poor, while the middle-class is being wiped out.
Closed Position on SLV (Silver ETF) Options – Made Small Profit
Sunday, September 26th, 2010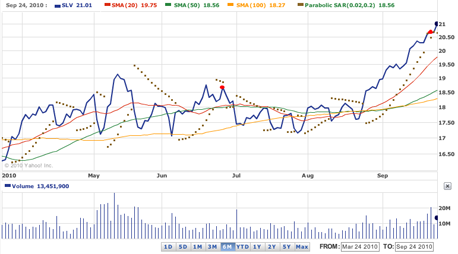
In previous post on MoneyAccumulator.com I wrote about the CALL options I bought on SLV (Silver ETF) for expiry of January 2010 with a strike price of $19. Well, I recently sold the options contract when the SLV ETF reached the price of $20.60.
Silver On The Move Above $20 – iShares Silver Trust (SLV) ETF
Thursday, September 16th, 2010
About 3 months ago, I bought contracts in iShares Silver Trust (SLV) ETF kind of as an experiment or litmus test to see my hunches are correct.
If the stock market and economy falters in the next 3 months by January 2010 SLV contracts with a strike price of $19 will make some money as long as the contract price exceeds my break even of $2.10. Currently the contract price is at $2.23 (Sept.16, 2010).
Dow Jones Finished Slightly Above 10,000
Sunday, August 29th, 2010
I posted on Tuesday, August 17th that the Dow Jones will drop to 10,000 points from 10,450 points then bounce a bit, and again head lower to the next support level 9,600. As you can see from trading the actions of August 26 and 27 that it is exactly how it is playing out.
Staying Out of Stocks Until Down Leg is Done – DJIA Shows Downtrend
Tuesday, August 17th, 2010
Looking at the 6 month chart for the DJIA, it looks like the market is at the beginning of a downtrend, the 10 and 200 day moving average is well over the price adding to downward pressure, however it looks like their might be a small pop upwards as the price hits the 50-day moving average, but after that my guess is that the downward trend will continue bringing the Dow Jones down to 10,000 and if it breaks past that down to 9,600 again. Also looking at the MACD it looks like a downward indicator as well ( please read my disclaimer). I have been wrong before so do your own due deligence, this is just my read on the market.
Timothy Sykes – PennyStocking DVD 4 – Charting, Self Publishing and Learn From Mistakes
Tuesday, July 27th, 2010
This review is both about DVD 4 of Timothy Sykes PennyStocking stock trading program as well as a review of the whole course content DVD 1-4. I will fist talk about DVD 4 and then about the overall quality of information of the entire course.
Timothy Sykes PennyStocking DVD 4 Review
I’m Out of Stocks For Next Little While
Tuesday, July 20th, 2010
Looking at my stock and index chart indicators, it looks like the markets are headed south for the next leg. I got out of my position over 2 weeks ago and now it is basically a waiting game, the indicators tell me that I should be in all cash and possibly the DJIA (Dow Jones Industrial Average) is going back under 10,000 within the next month.